-
Original Product
-
Lifetime Licensed
Graphs & Charts for Elementor

*** If you select any additional services, please add your website login details in the ADDITIONAL INFORMATION section during checkout to allow us to perform the desired actions on your website.
Boost Your Website with Graphs & Charts for Elementor
Creating a visually appealing website is crucial in today’s digital landscape, especially if you want to convey complex data in a user-friendly manner. You might be wondering how to achieve this without extensive coding skills. The answer lies in the advanced capabilities of the Graphs & Charts for Elementor plugin.
Imagine you are a digital marketing agency presenting quarterly performance metrics to your clients. The raw data might be impressive, but without clear visualization, it can easily overwhelm or confuse your audience. This is where the Graphs & Charts for Elementor plugin shines, allowing you to transform cumbersome data sets into aesthetically pleasing charts that grab attention and tell a story.
Unleash the Power of Data Visualization
The Graphs & Charts for Elementor plugin is specifically designed to meet the needs of those who wish to integrate data visualization seamlessly into their websites. Built on the renowned Chartist.js library, this plugin offers a versatile set of widgets that facilitate the creation of various types of graphs and charts.
Here’s a quick overview of the types of charts you can create:
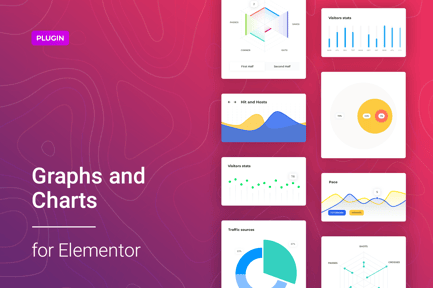
– Line Chart Widget: Ideal for showing trends over time.
– Bar Chart Widget: Perfect for comparing quantities across different categories.
– Pie Chart Widget: Great for depicting proportions of a whole.
– Donut Chart Widget: Offers a modern twist on the classic pie chart.
– Gauge Chart Widget: Useful for showcasing progress against a target.
– Dots Chart Widget: Highlights individual data points clearly.
– Bi-polar Line Chart Widget: Ideal for comparing two different datasets.
– Bi-polar Bar Chart Widget: Excellent for highlighting contrasting values.
– Multiline Bar Chart Widget: Perfect for comparing multiple lines in one view.
– Stacked Bar Chart Widget: Allows for layered comparisons.
– Area Chart Widget: Effective for illustrating data trends over time.
– Holes Chart Widget: Adds a unique perspective to your data representation.
Key Features Tailored for Your Needs
1. User-Friendly Customization
One of the standout features of the Graphs & Charts for Elementor plugin is its flexibility. You can easily add the required amount of data and adjust elements like colors, fonts, paddings, and margins directly from the Elementor interface. This means you don’t need to worry about coding or technical skills—simply click and configure to get the desired appearance.
2. Compatibility and Performance
Regardless of the theme you choose or the browser your users prefer, this plugin seamlessly integrates with all WordPress themes built on Elementor. It supports all major browsers, ensuring that your charts look great on Chrome, Firefox, Safari, Opera, and Edge. Plus, it’s lightweight and fast, ensuring quick load times—essential for enhanced user experience and SEO.
3. Responsive Design
Today’s users access websites on various devices—desktops, tablets, and smartphones. The Graphs & Charts for Elementor plugin ensures your charts are fully responsive, meaning they will automatically adjust to fit any screen size without losing quality or clarity.
4. SEO Friendly
Your data visualizations won’t just be visually enticing; they’ll also be optimized for search engines. With a focus on SEO-friendliness, the plugin integrates well into your overall website structure, helping enhance your site’s visibility.
5. Comprehensive Support
Not just a plugin, but a solution—when you purchase this plugin from CodeCanyon, you also receive six months of support. You’ll have access to installation guides and detailed user manuals, ensuring you can maximize the plugin’s features with ease.
Ideal Use Cases for Your Website
The usability of the Graphs & Charts for Elementor plugin extends far beyond mere aesthetics. Here are some scenarios where this plugin is indispensable:
– Business Reports: Use various chart types to make your quarterly or annual reports more accessible and engaging for stakeholders.
– Educational Platforms: Visualize learning metrics, student performance, and other statistics effectively within online courses.
– Health Analytics: Display critical health data and trends in a compelling manner for healthcare professionals and institutions.
– Market Research: Showcase survey results and analytics in a clear and visually appealing manner to clients and colleagues.
The Right Choice for Your Website
In conclusion, if you are looking to enhance your site’s aesthetics while providing essential data visualization capabilities, then the Graphs & Charts for Elementor plugin is your ultimate solution. Offering extensive customization, robust compatibility, and a variety of chart types, it empowers website creators—from bloggers to business owners—to present data in a clear and impactful way.
Don’t wait to elevate your online presence! Dive into the world of data visualization with Graphs & Charts for Elementor today and see the difference it makes for your website. Whether you aim to inform, persuade, or engage your audience, this potent tool is the key to unlocking your website’s potential.
| Support and Updates |
Documentation IncludedUpdates includedPersonalized support not included |
|---|---|
| File Types |
CSS, SASS, JS, HTML |
| Additions |
Retina readyResponsive |
| Compatible Versions |
Tested up to version 5.1 |


